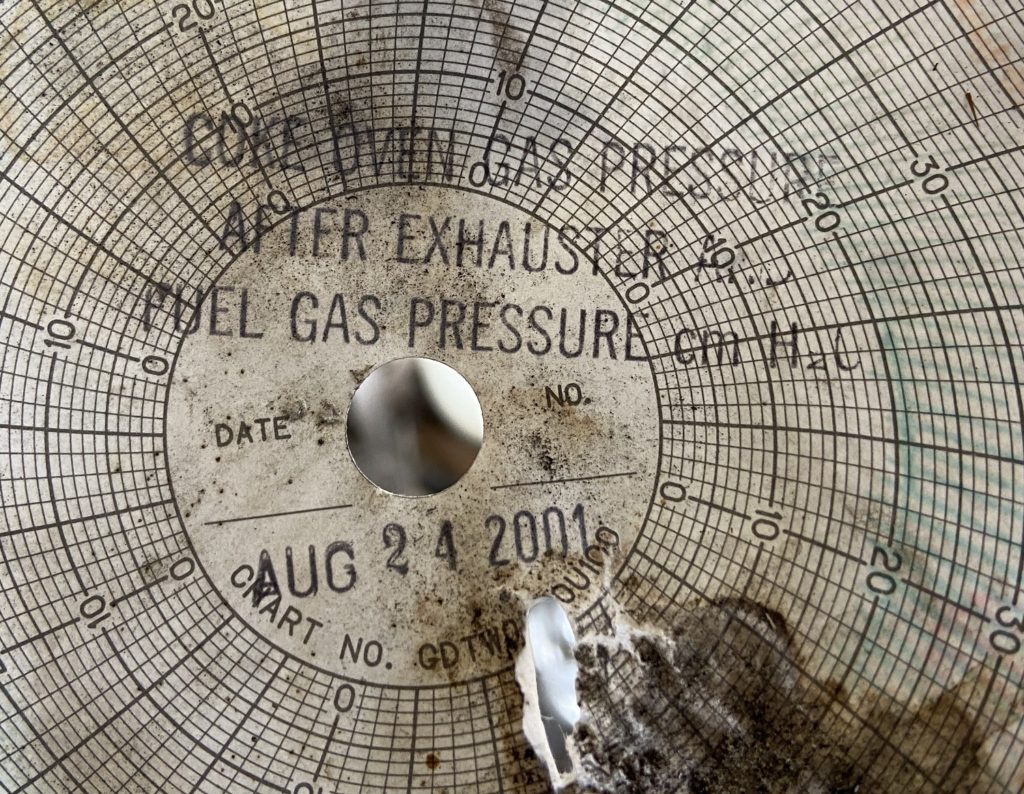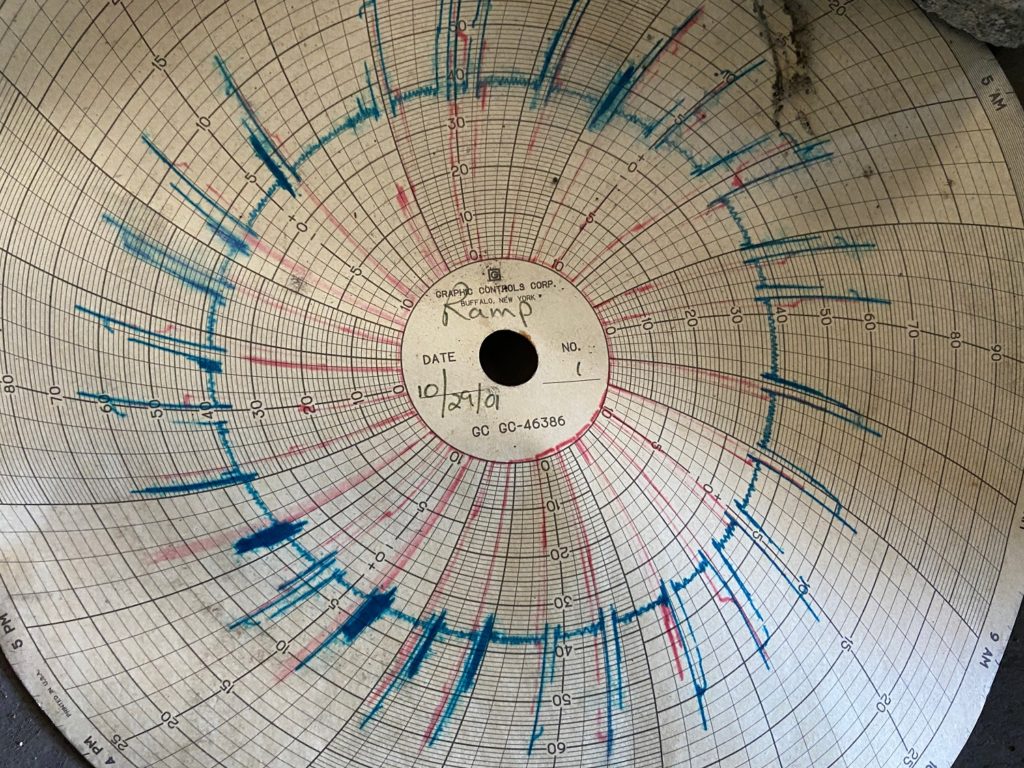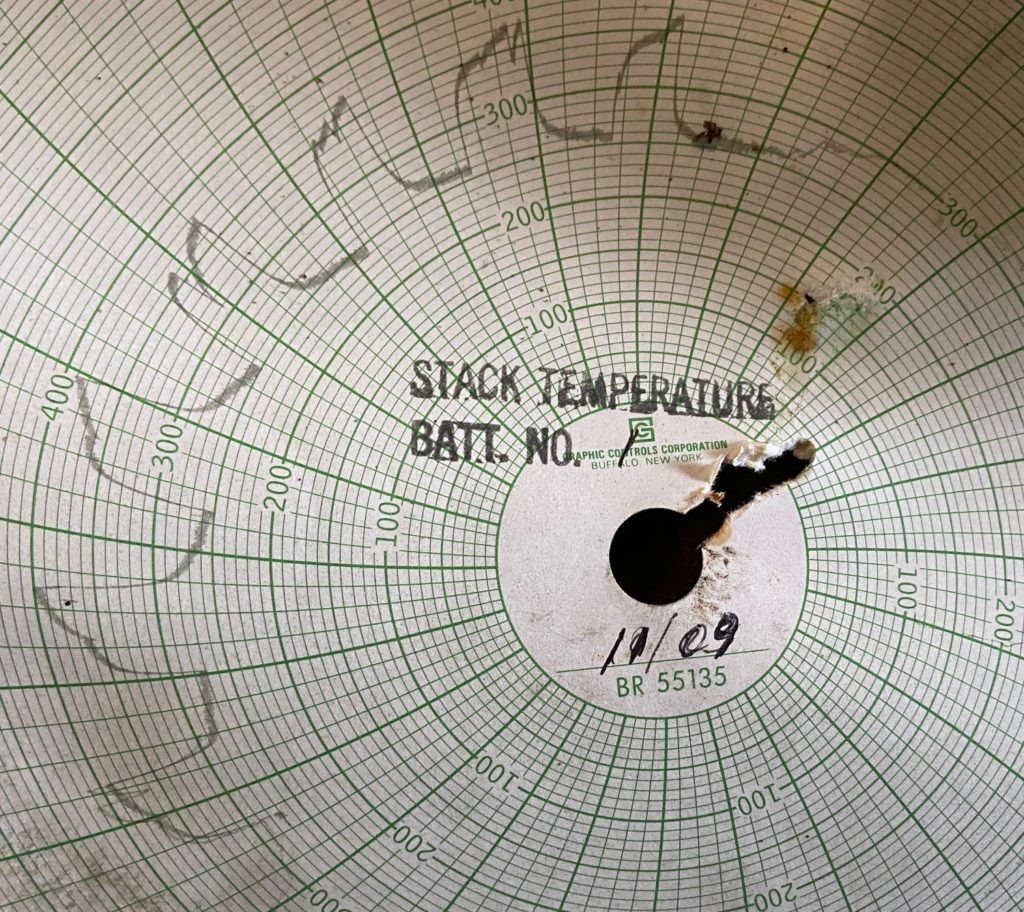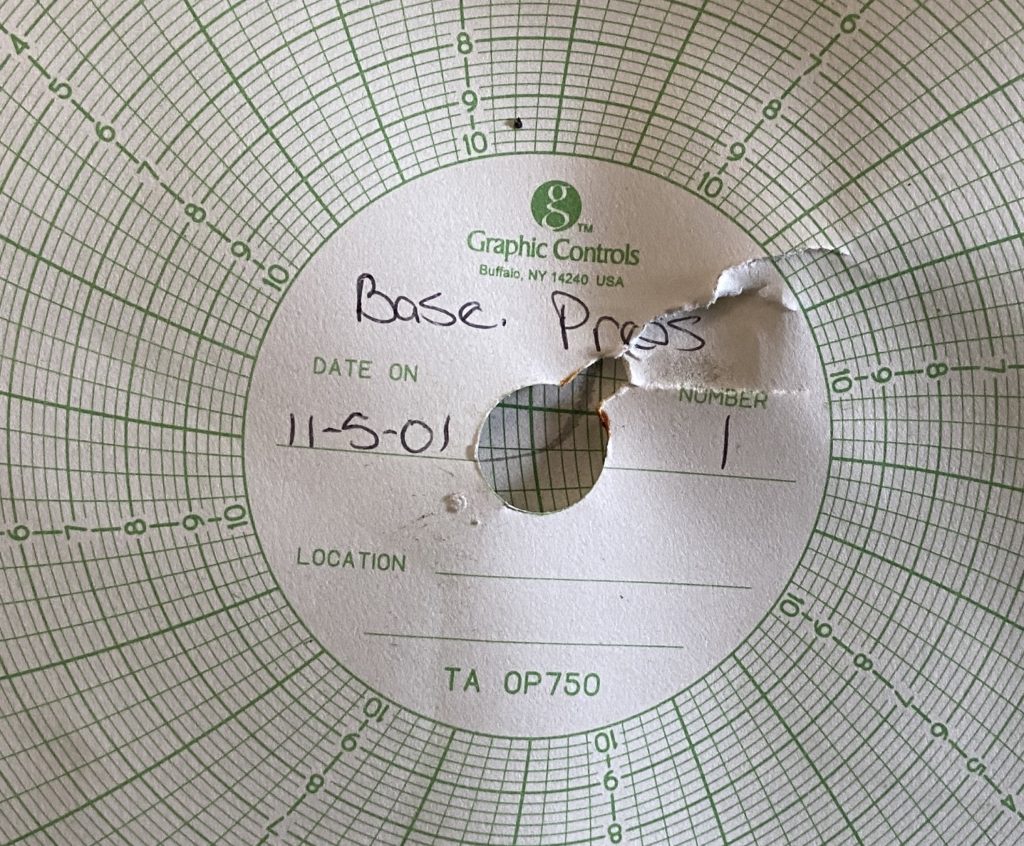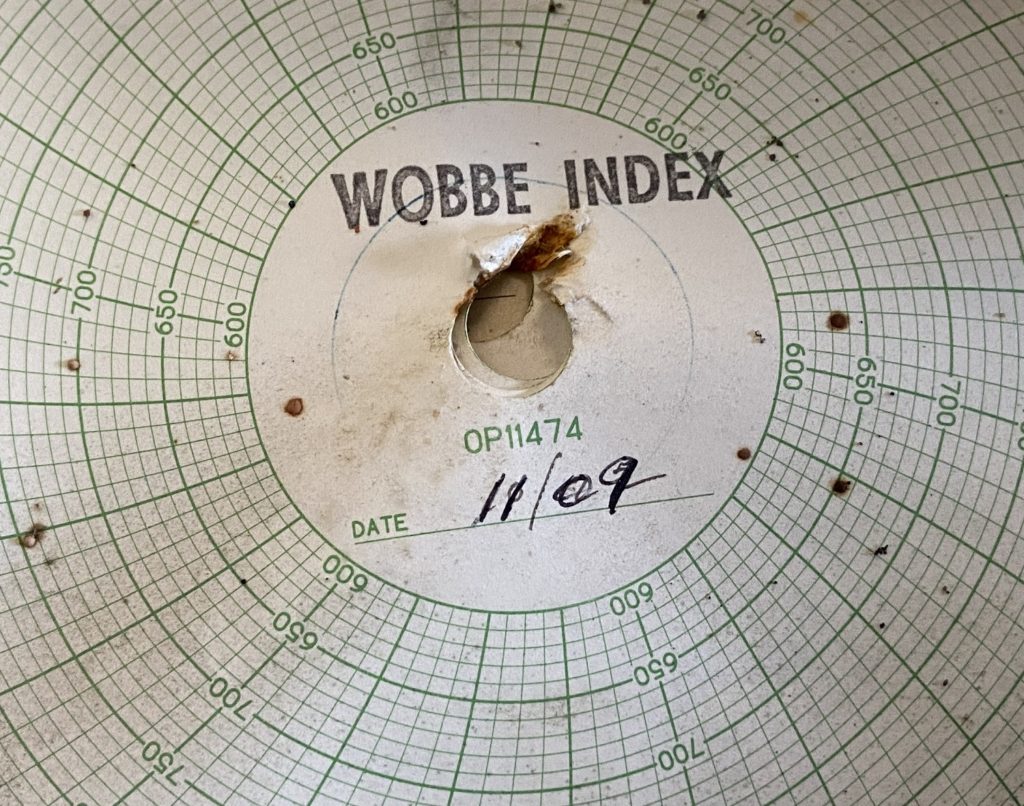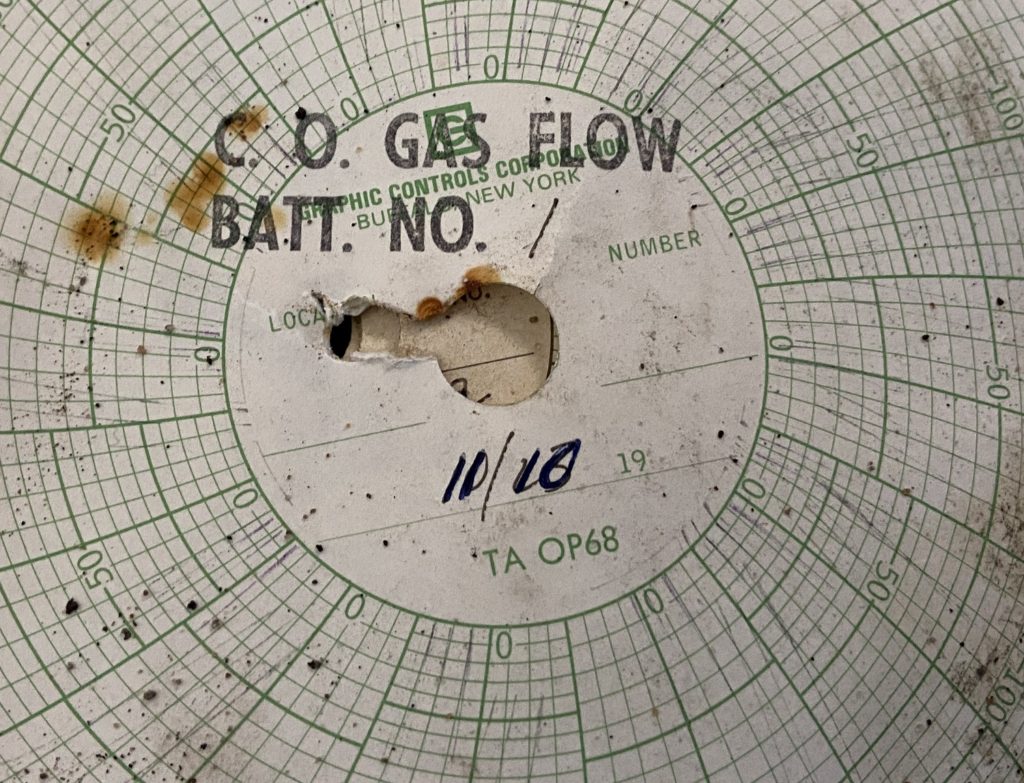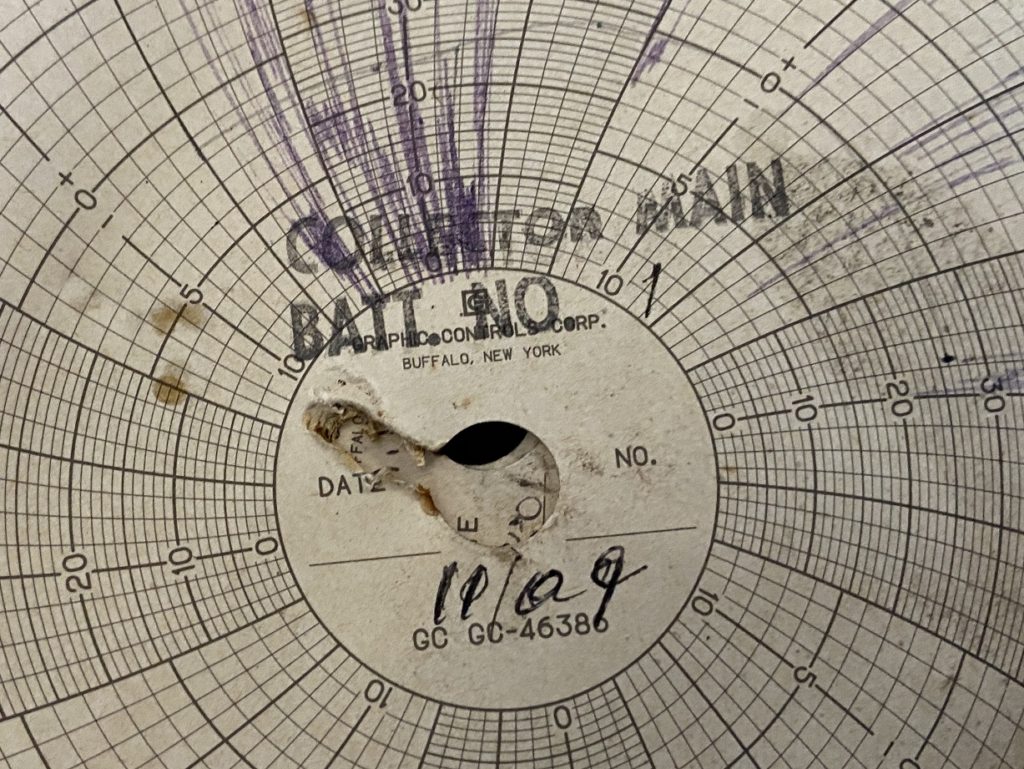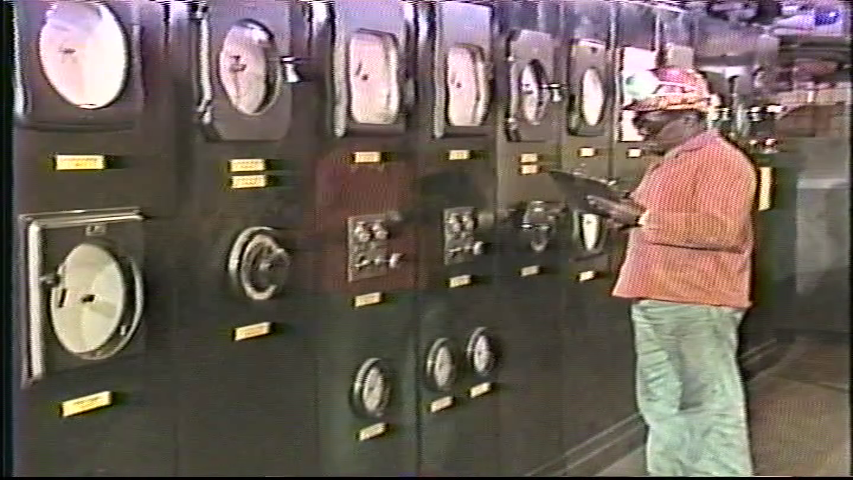

24 hour circular charts were the recording medium of choice at Acme. These charts were used to record a variety of metrics both at the batteries (where recording was done in the coal bunker ground floor) at the BP Plant (charts were stored in the BP Office).
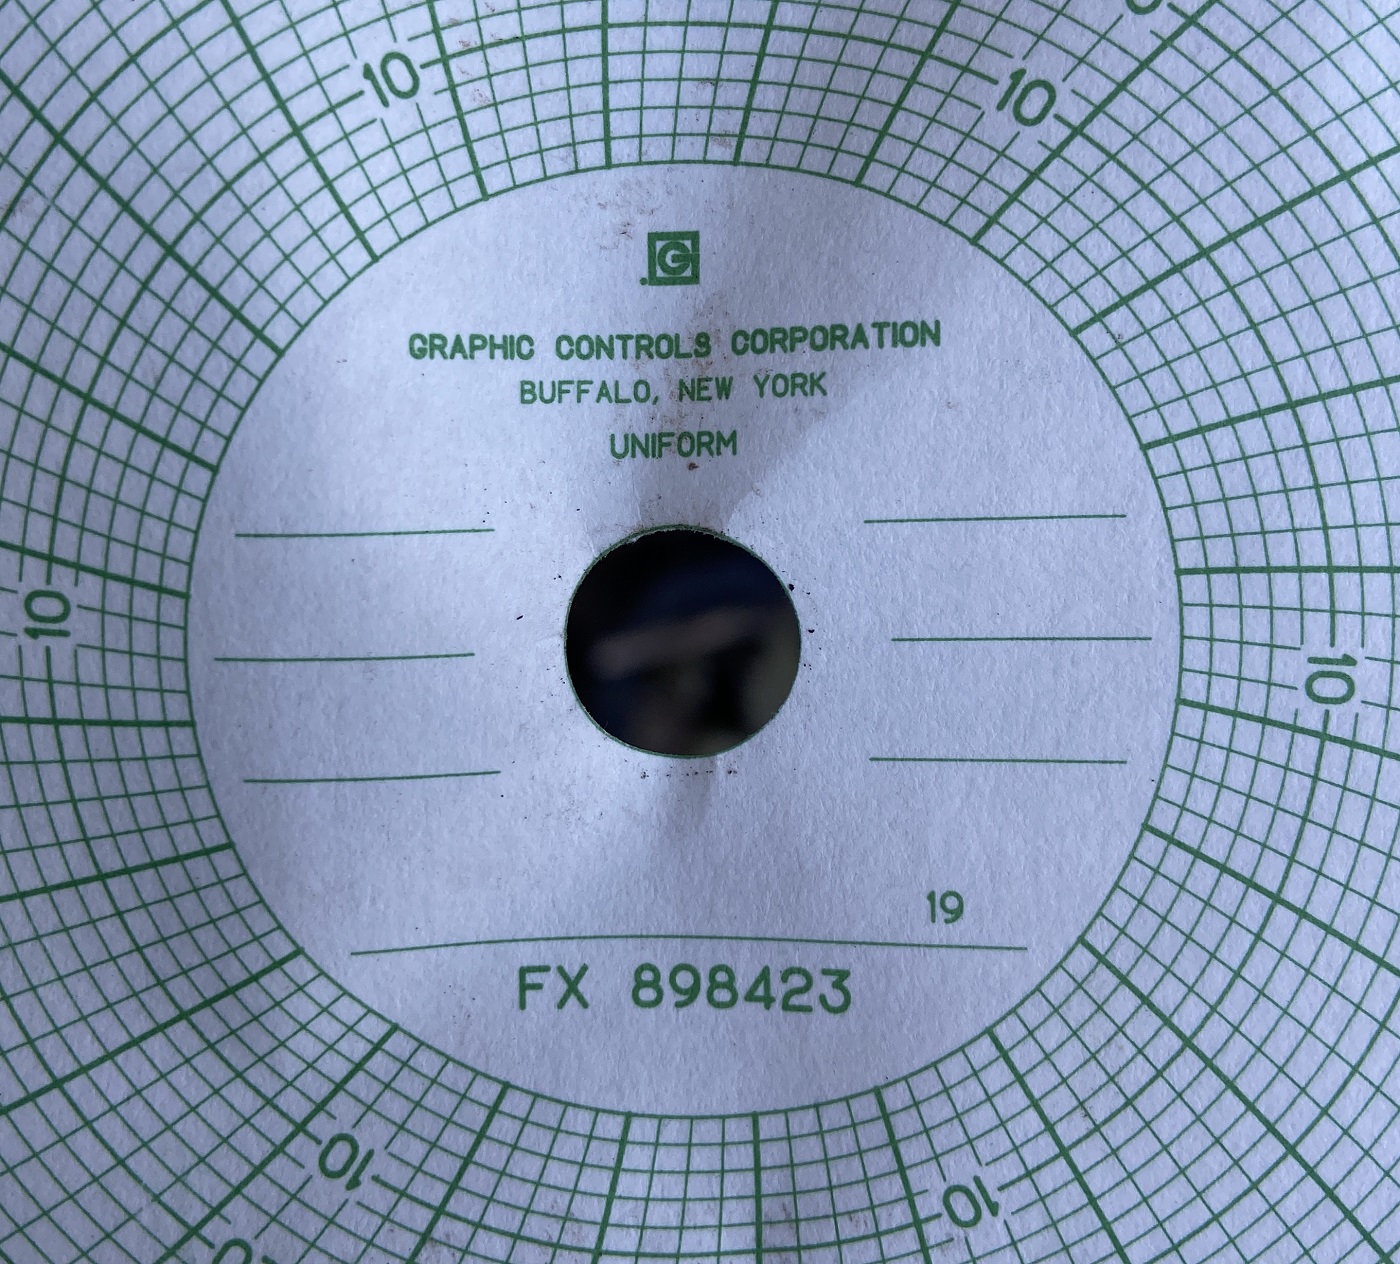
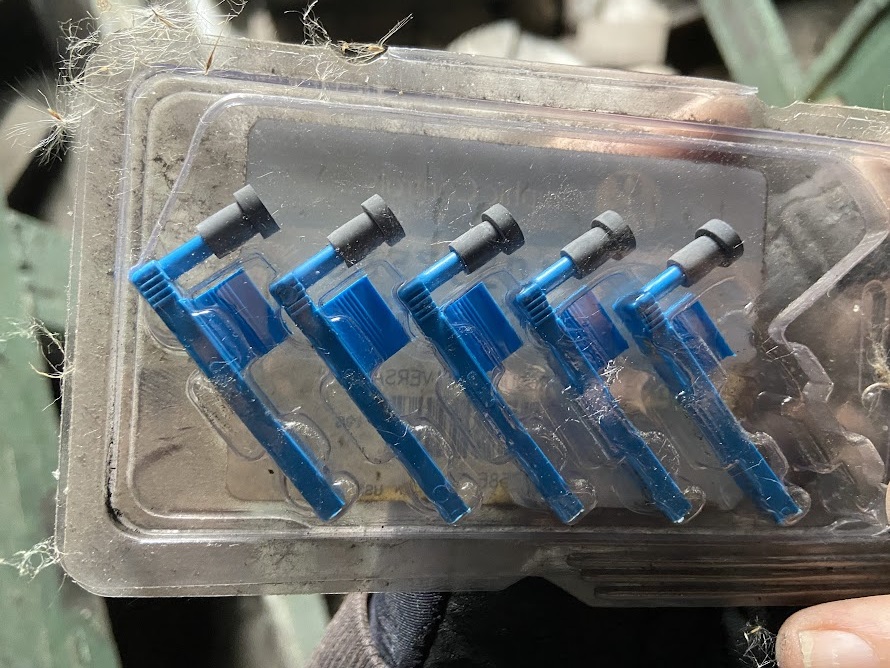
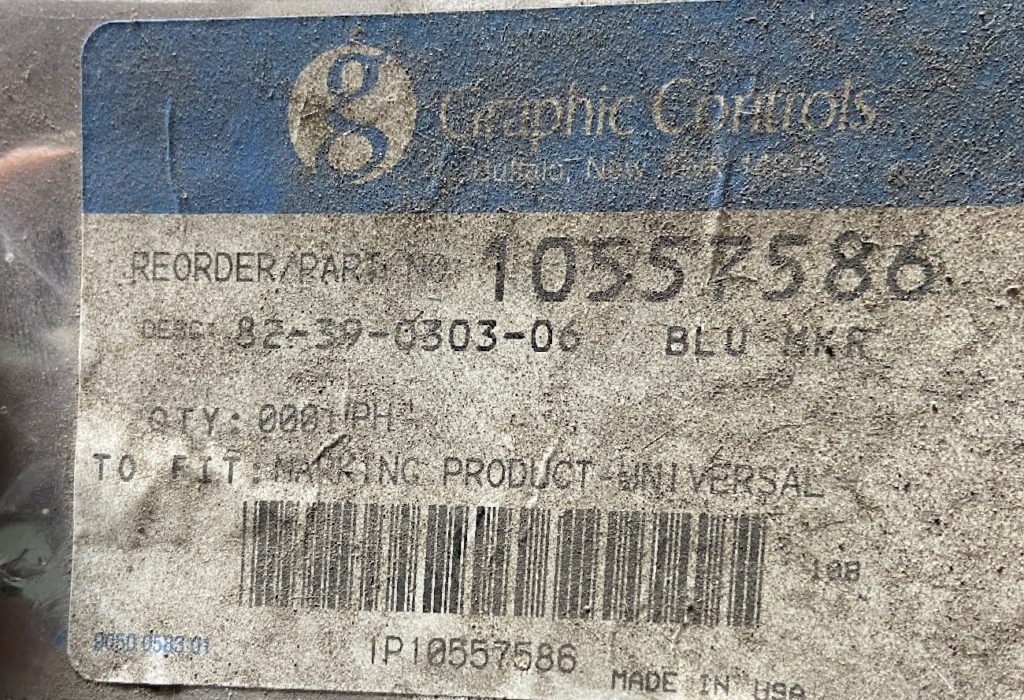
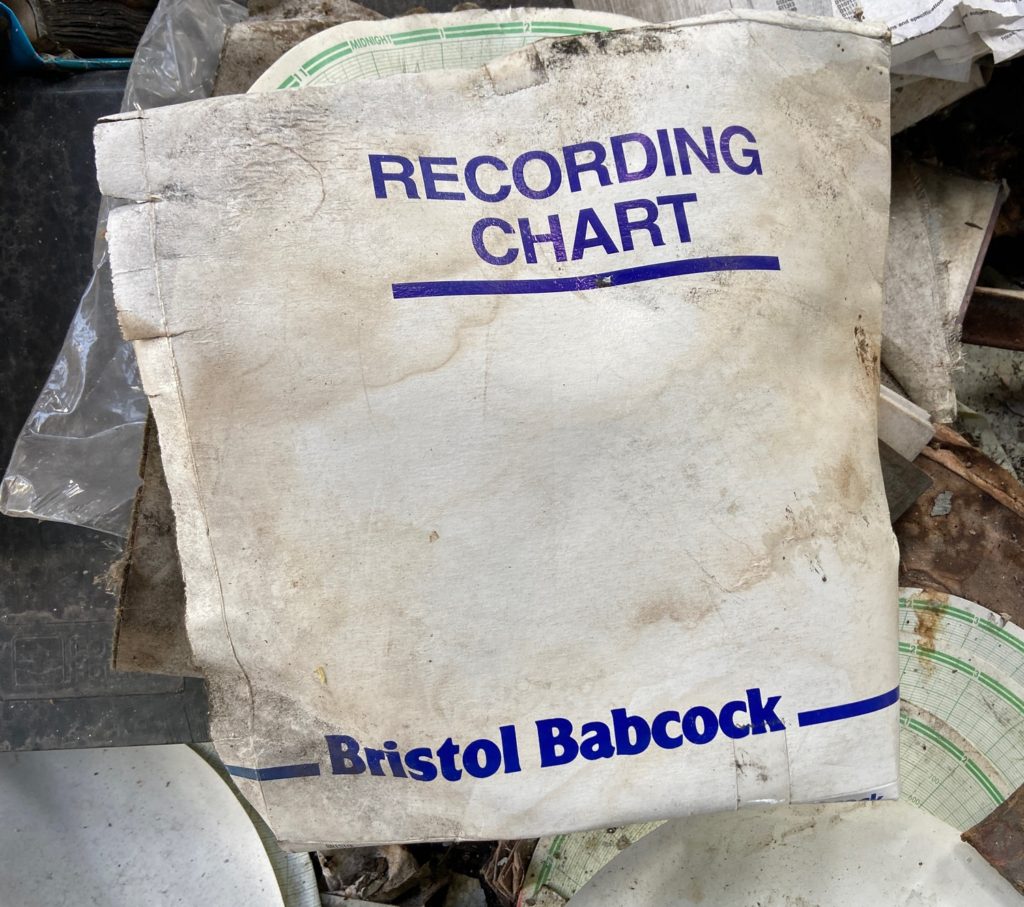
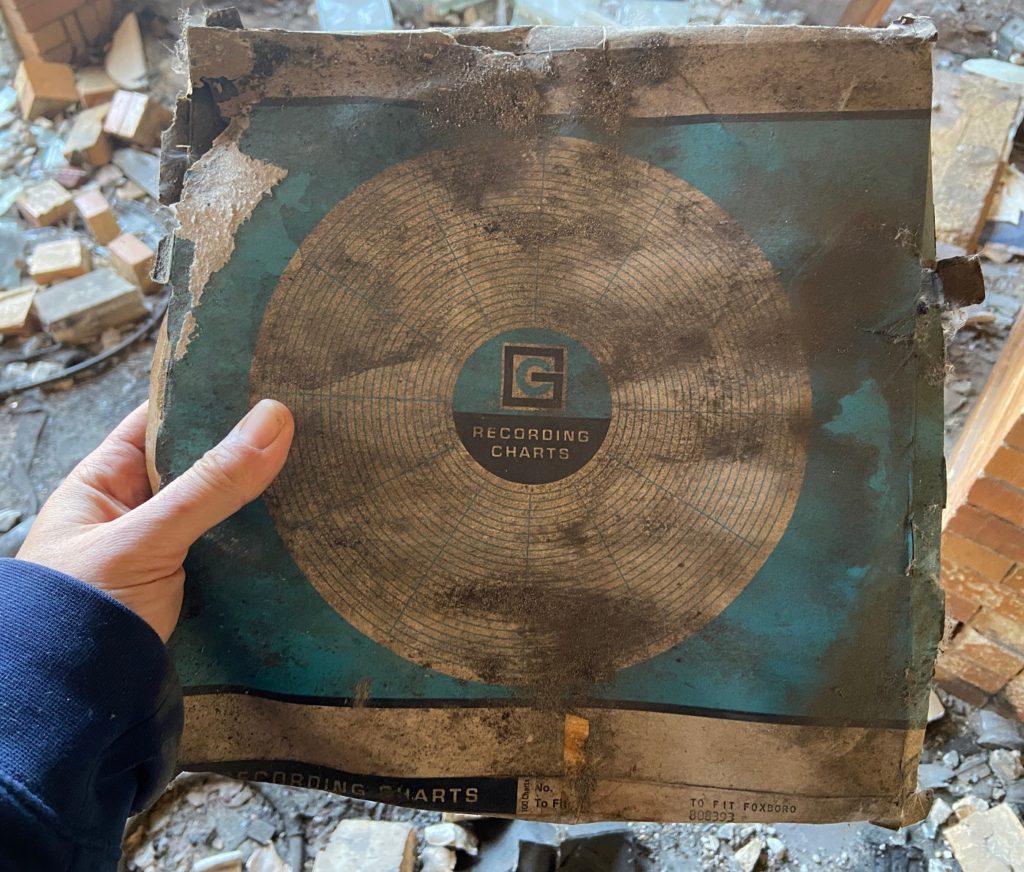
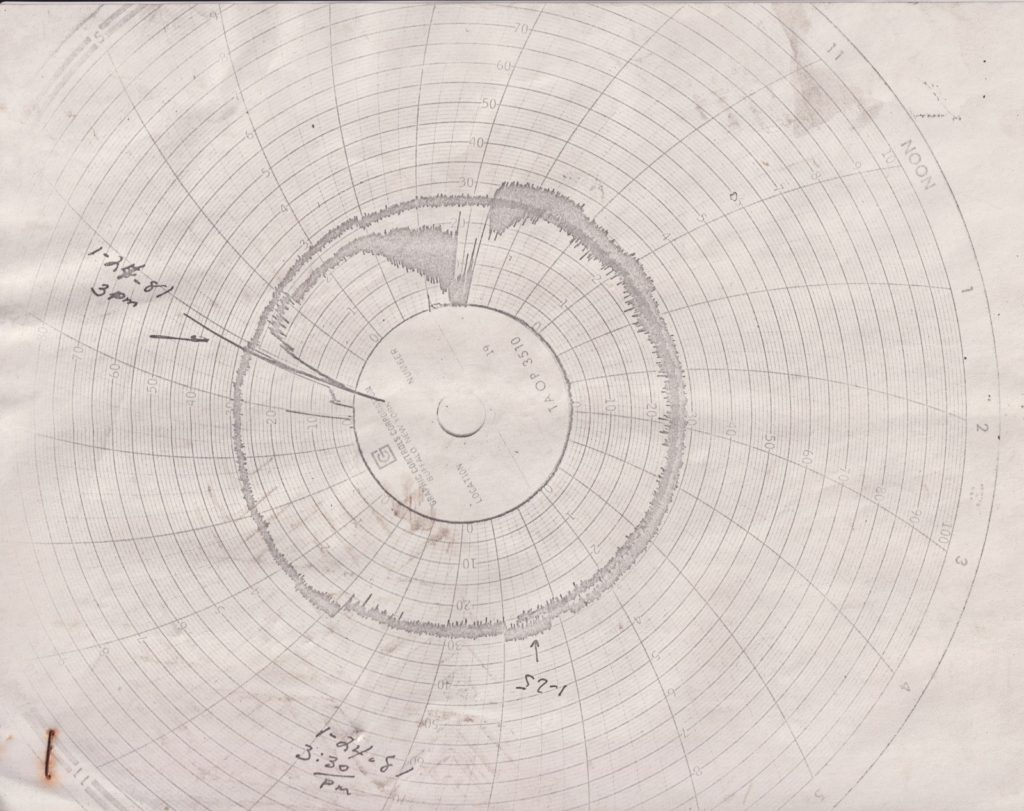
BP Plant Charts
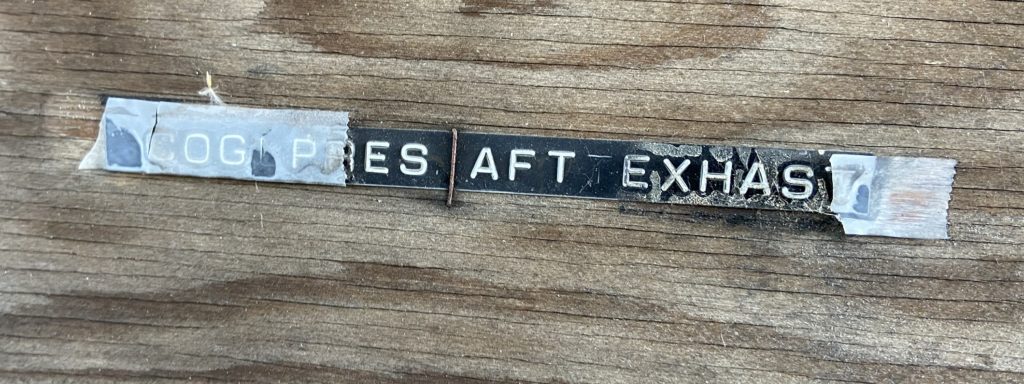
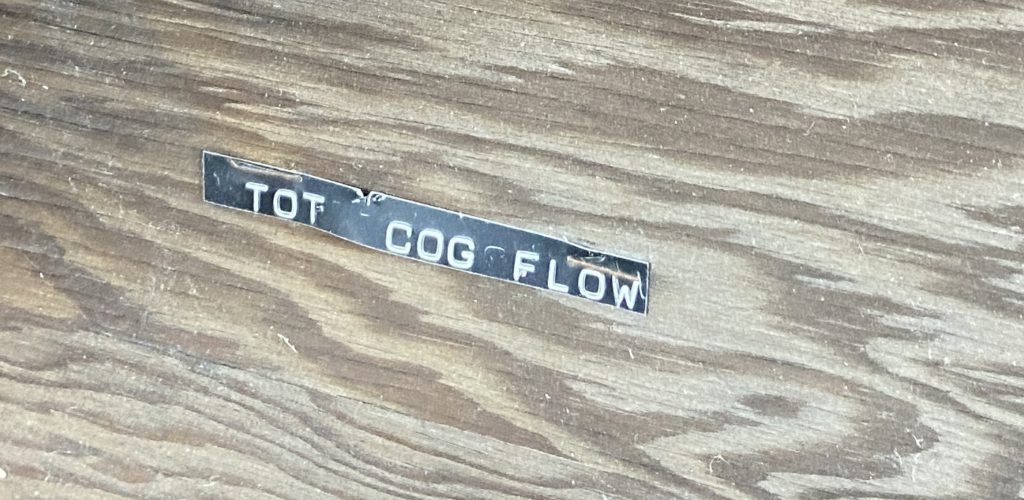
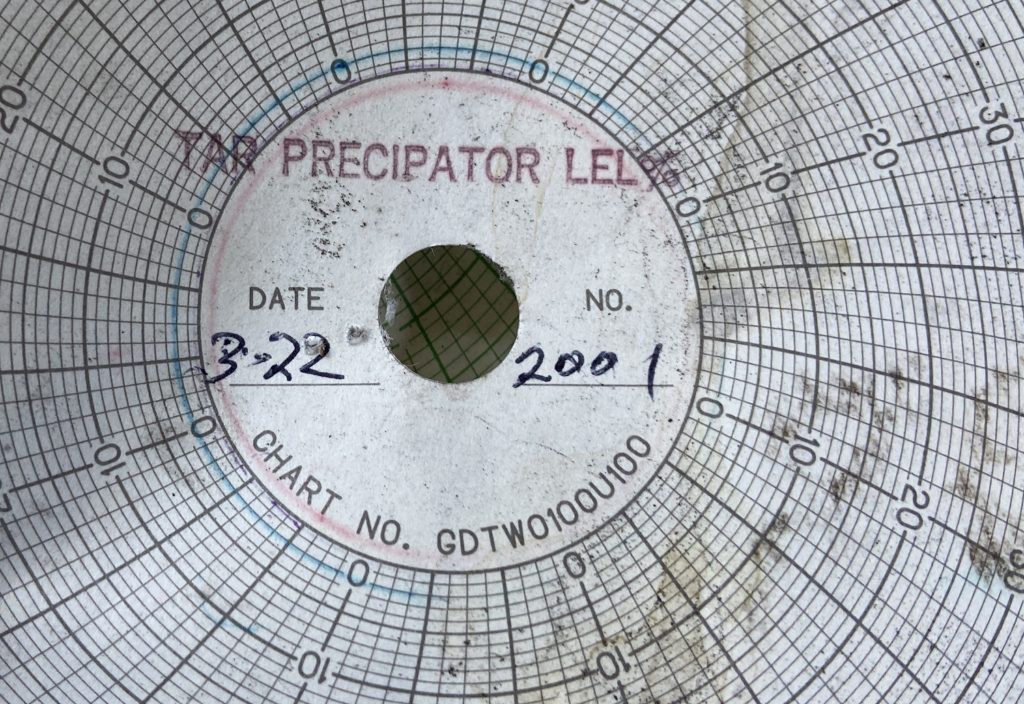
In the BP office a large board is on the north wall of the center room of the building. Spikes were driven into it to hold the circular charts by their centers. The charts are gone, but a label maker was used to mark the chart locations. I found a few in the rubble of the room after a brief search.
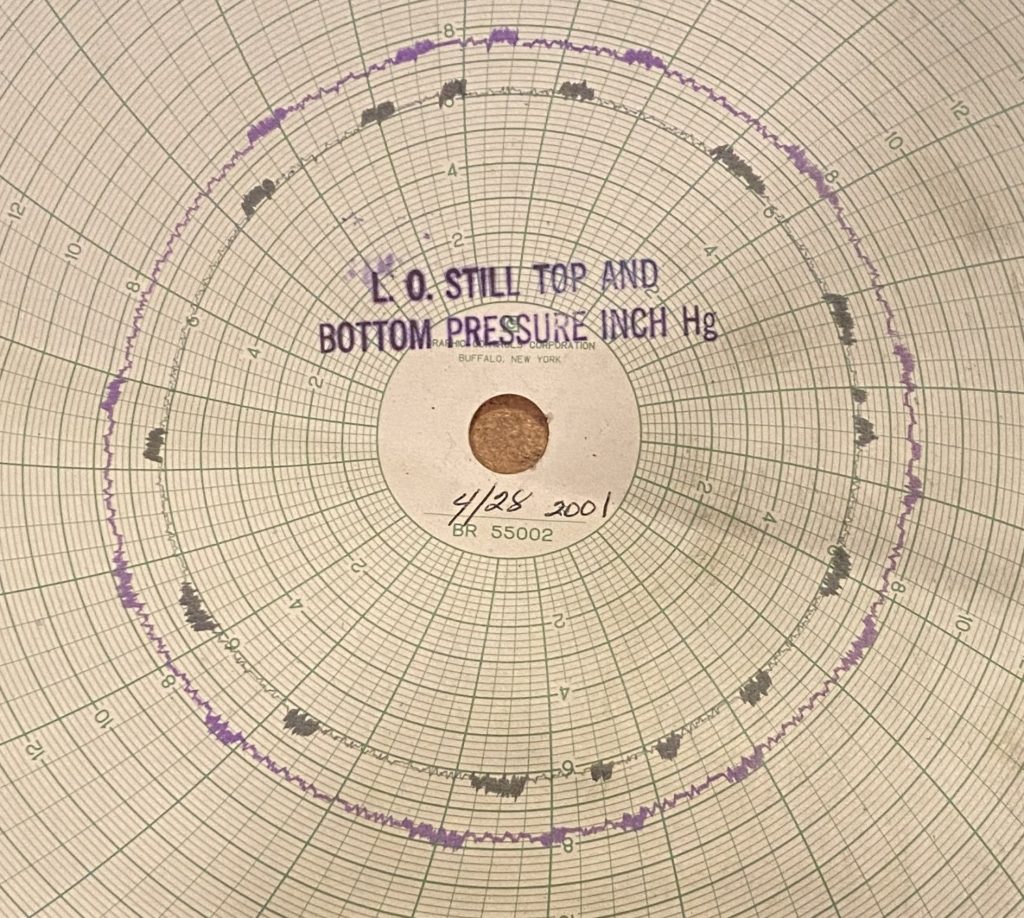
Measurement (in inches of mercury – 1″ = 0.495115 PSI) of differential pressure across the light oil still to indicate:
-the incoming pressure which would be adjusted to maintain a still top temperature for proper distillation;
-the drop across the column to indicate blockage.
Ovens Dept. Charts
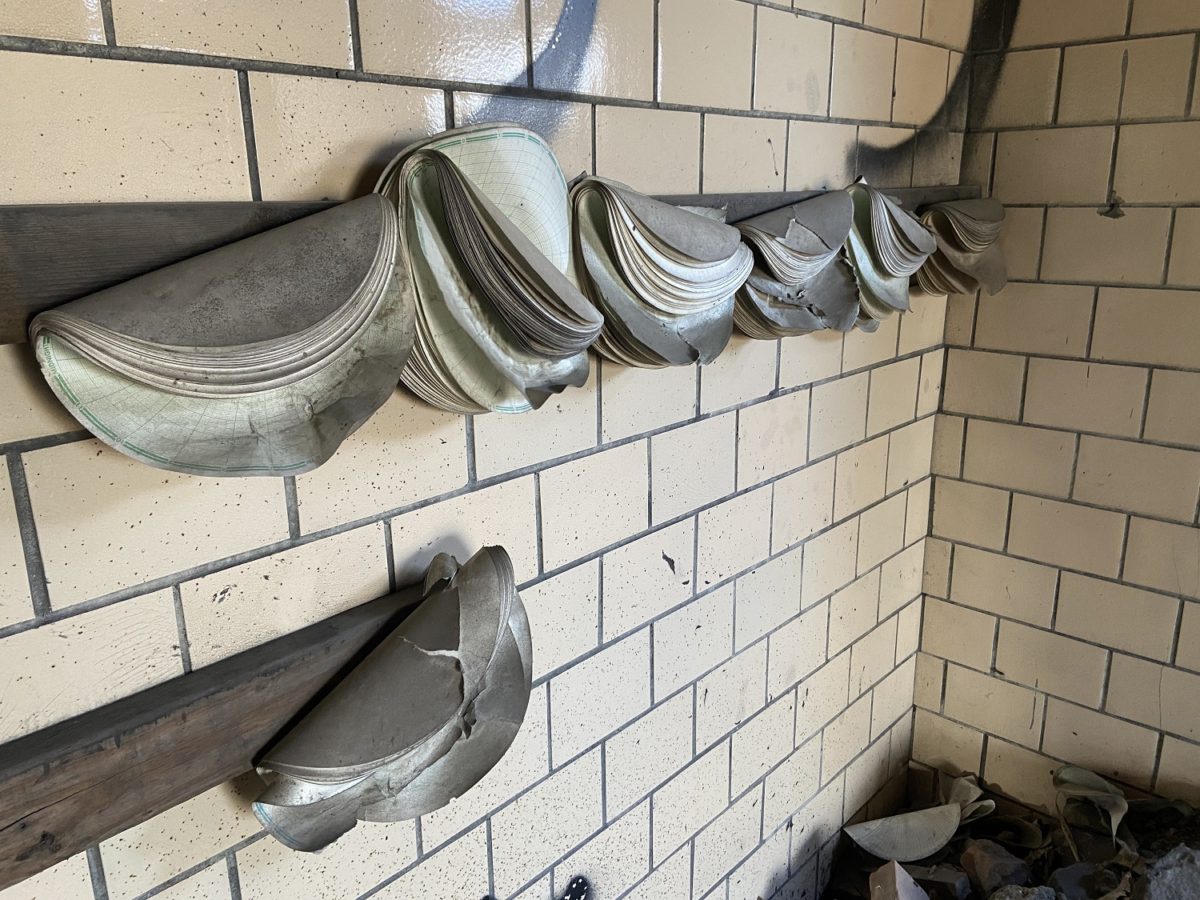
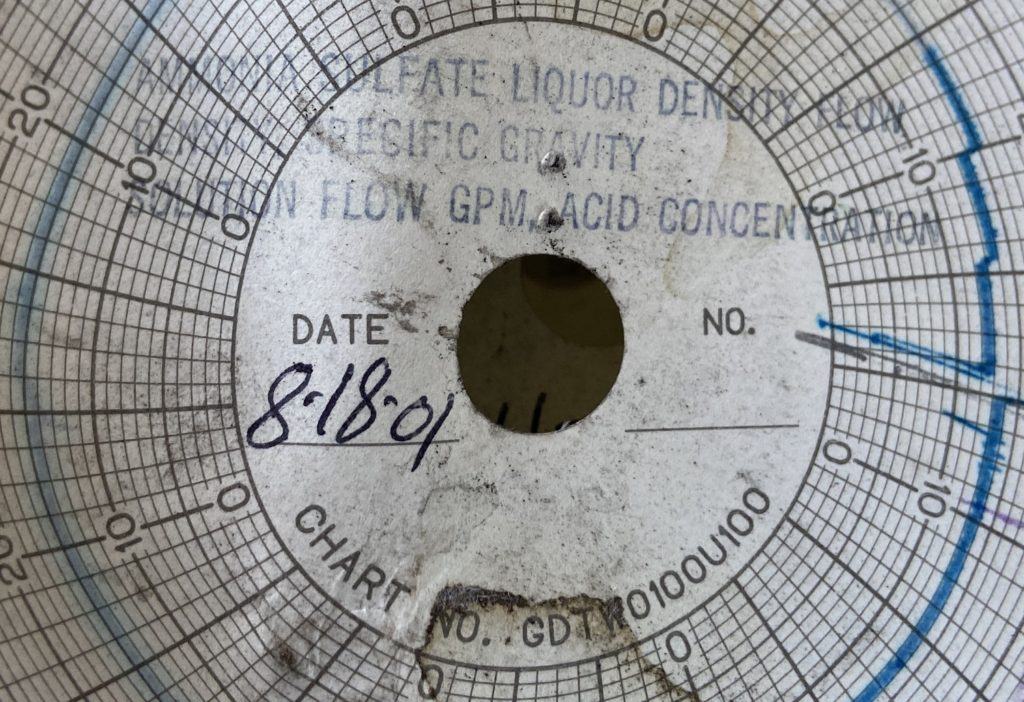
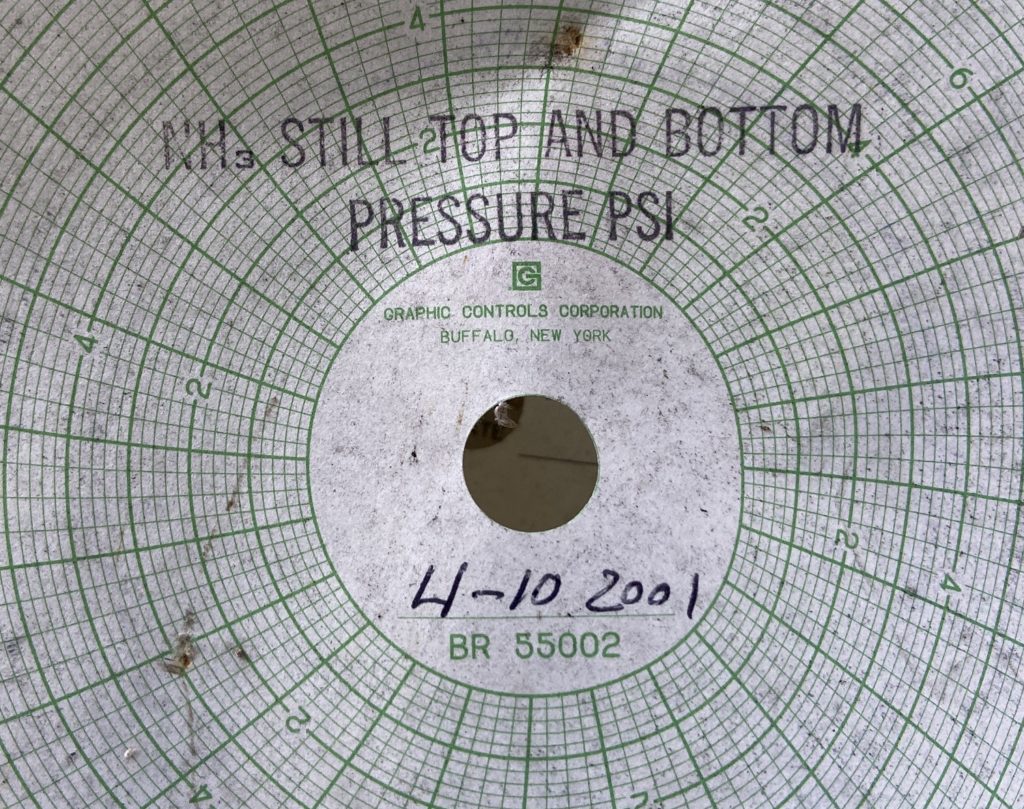
The ground floor of the coal bunker once contained a great many recording devices for circular charts (as seen in the two photos at the top of this post; those photos were taken from the ovens department training video). The charts still hang to this day on the west wall of the east half of the ground floor (a wall bisects the area into two halves). Even more shocking than the fact that they have been hanging there for more than 20 years is that on the outside of the stacks you will find charts from November 2001, some recordings taken only weeks before the plant shut down.
